

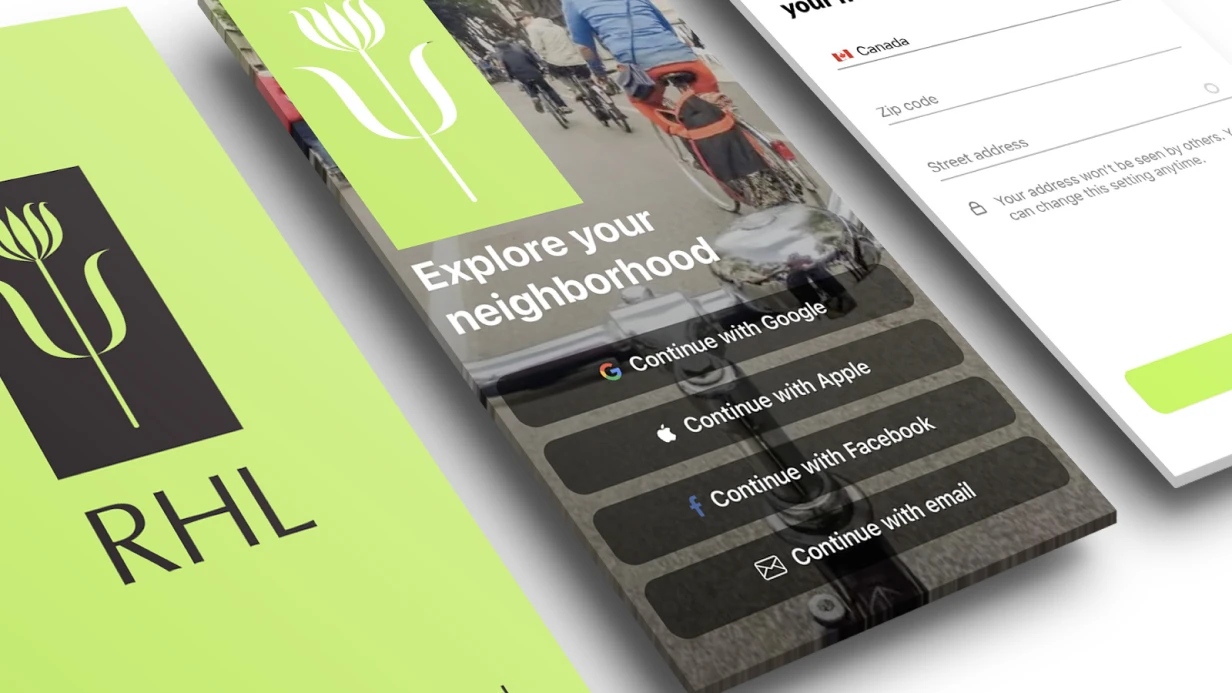
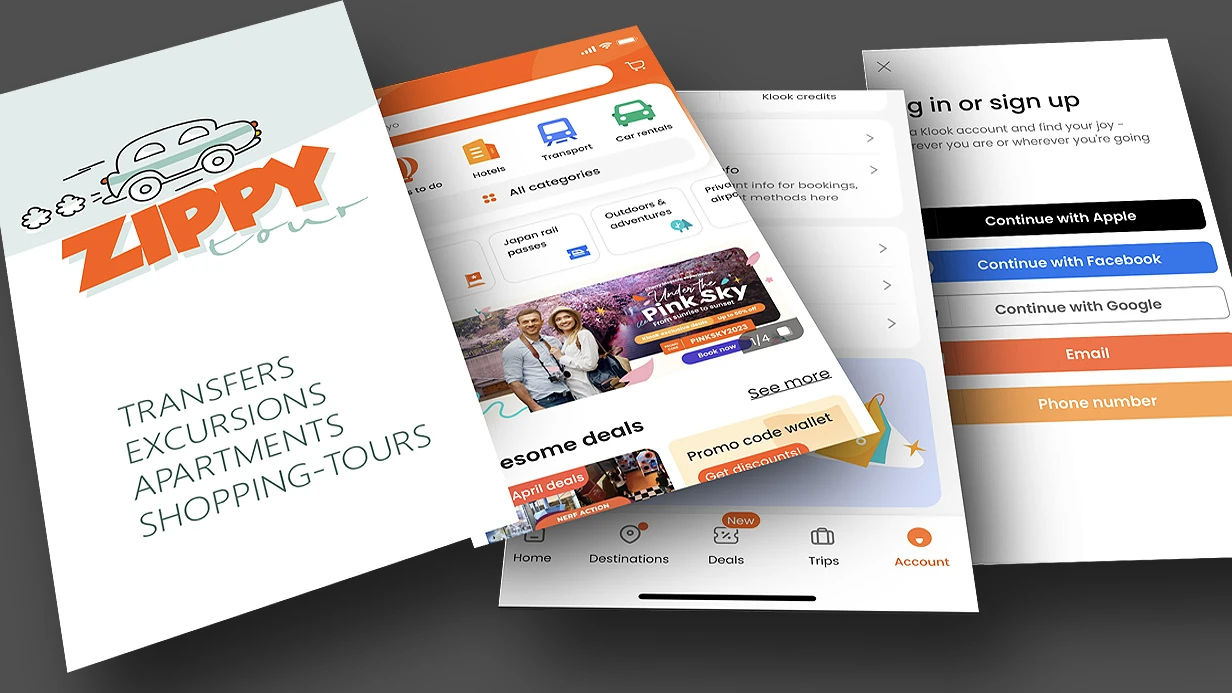
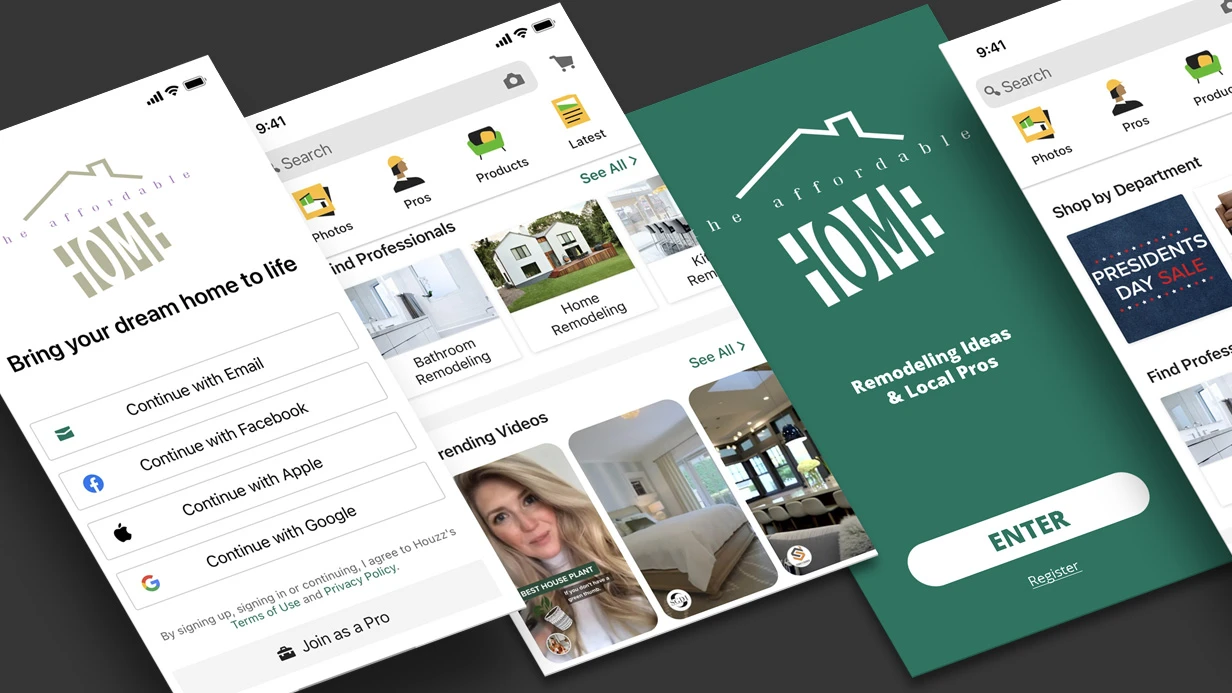
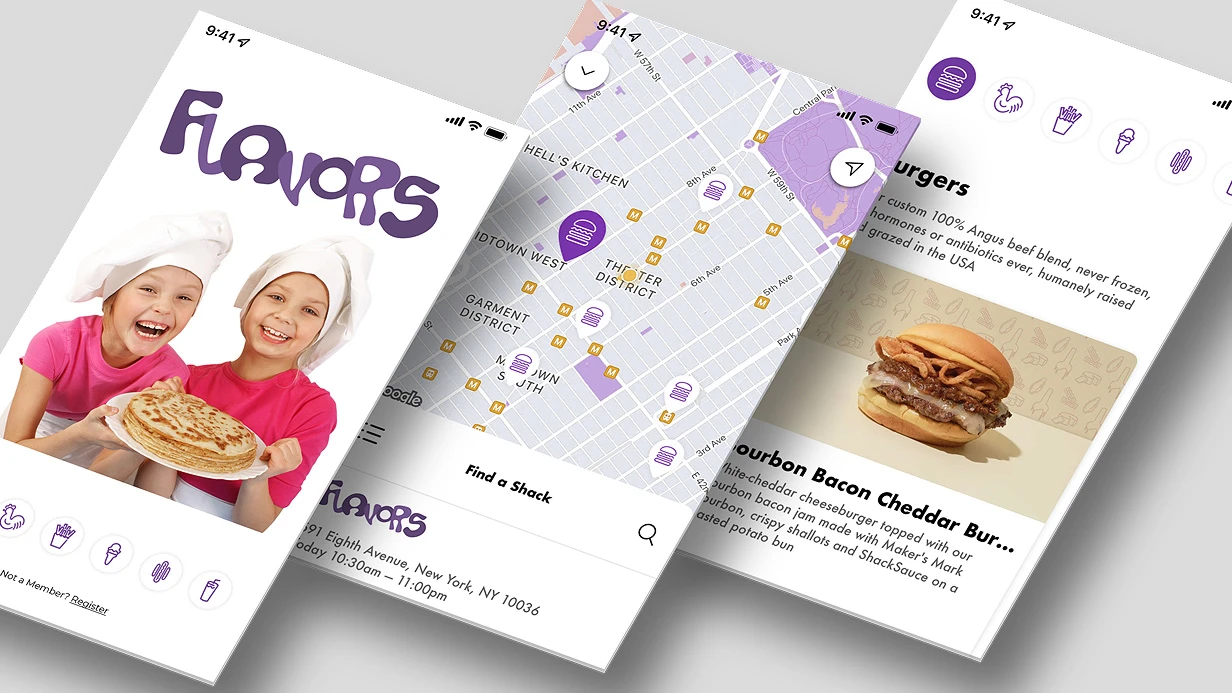
Imagine: a user downloads an app, opens it, sees three generic slides — "Fast," "Convenient," "Reliable" — and closes it 15 seconds later. They didn't understand why this app exists.
According to Localytics, 25% of users delete an app after the first launch because they don't understand its value. This happens when onboarding isn't aimed at first value.
We design differently: we start with a specific action the user wants to take and lead them to it in minimal time. Every onboarding is built around the target action, minimizing cognitive load.
Our approach uses progressive disclosure and personalized scenarios, validated across 50+ iOS and Android projects.
The average increase in day-7 retention is 20-30%, which brings additional revenue through significant savings on acquisition marketing.
How to reduce user churn with onboarding?
The classic three-slide onboarding with illustrations "Fast," "Convenient," "Reliable" — doesn't work.
The user scrolls through them blindly and taps "Start." Such onboarding gives neither an understanding of the product nor a first valuable action.
Working patterns:
- Progressive disclosure — show features as the user gets to them. The first screen — the key action, the rest — later.
- Benefit-focused — "Track expenses in 10 seconds" instead of abstract promises.
- Minimal onboarding to first value — if the user can try the app without registration, don't force them to register on the first screen.
- Permission requests in context — request access to geolocation only when the feature is needed, then the user understands why.
Typical mistakes when designing onboarding
- Overloading with text: users don't read, they skim. - Requesting permissions at the start without context: reduces conversion. - Onboarding that is too long: more than 5 screens reduces completion. - Lack of a skip option: annoys experienced users.How we design onboarding
We start with an analysis of the target action (first value). For each project, we determine: what the user must do in the first 30 seconds to want to stay. Then we design the flow from opening to that action, taking into account the platform specifics of iOS and Android.
Technical aspects: iOS vs Android
For iOS, we use UIPageViewController with transition animations, and integrate SKStoreReviewController to request a review after onboarding. On Android — ViewPager2 with TabLayout, adaptive layouts in Jetpack Compose.
Deep links (Universal Links / App Links) allow opening the desired screen after installation. Permissions (push notifications, geolocation) are requested via UNUserNotificationCenter and ActivityResultContracts respectively — strictly in context.
Tools and stack
- Prototypes: Figma with real content (not lorem ipsum) and interactive transitions.
- Animations: Principle or After Effects for micro-interactions, export to Lottie for developers.
- Versioning: Git LFS for design files, Abstract for collaboration.
Comparison of onboarding types
| Type | Example | When to use | Implementation complexity |
|---|---|---|---|
| Welcome slides | Three screens with features | For simple apps | Low |
| Setup wizard | Selecting a goal, activity level | Apps with settings | Medium |
| Empty state | "Add your first project" | Apps with UGC | Low |
| Interactive tutorial | Highlighting interface elements | Complex interfaces | High |
Why is our approach more effective?
We rely on data: A/B tests on real users show a 15–30% increase in 7-day retention. We guarantee that your onboarding will be tested on your target audience using tools like Firebase A/B Testing. We do not use templated solutions — every flow is unique.
Quality onboarding pays for itself by reducing churn: every percentage point of retained users brings additional revenue. Get a consultation to discuss your project and receive a preliminary estimate.
What is included in onboarding development work?
- Analysis of the target action and the path to first value.
- Flow design (3–5 screens) taking into account permissions and deep links.
- Design in Figma with real content and animation notes.
- Delivery: Figma source files, transition specification, PNG/PDF export.
KPI performance metrics
| Metric | Baseline value | Target improvement |
|---|---|---|
| Retention Day 1 | 30-40% | +15-20% |
| Retention Day 7 | 15-20% | +20-30% |
| Time to first action | 60-90 sec | <30 sec |
| Onboarding completion rate | 70% | >90% |
Work process
- Analytics — audit of the current onboarding (if any), usability testing with 5 users.
- Design — wireframes, customer journey map, error scenarios.
- Design — visual screens, prototype animation in Figma.
- Testing — A/B test on 50+ real users (Firebase A/B Testing).
- Handoff to developers — Figma layout with comments, animation specification.
Estimated timeline
From 1 to 3 business days for onboarding design (3–5 screens). Cost is calculated individually — get in touch to discuss your project. The investment in onboarding pays for itself in 2-3 months through retention growth. Order onboarding design — start improving retention today.