

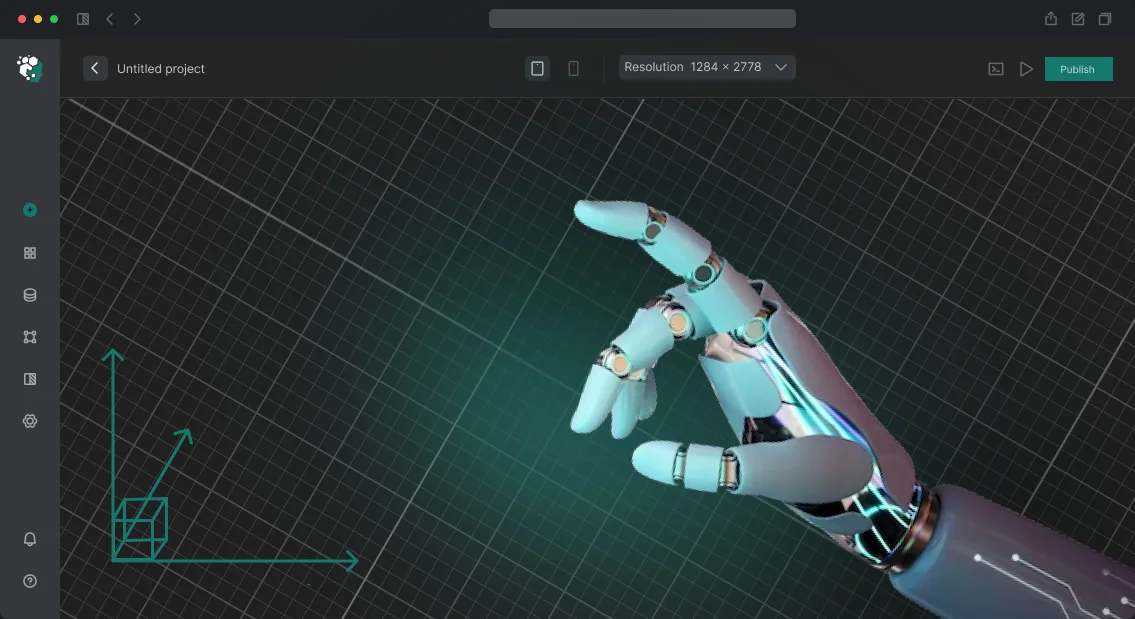
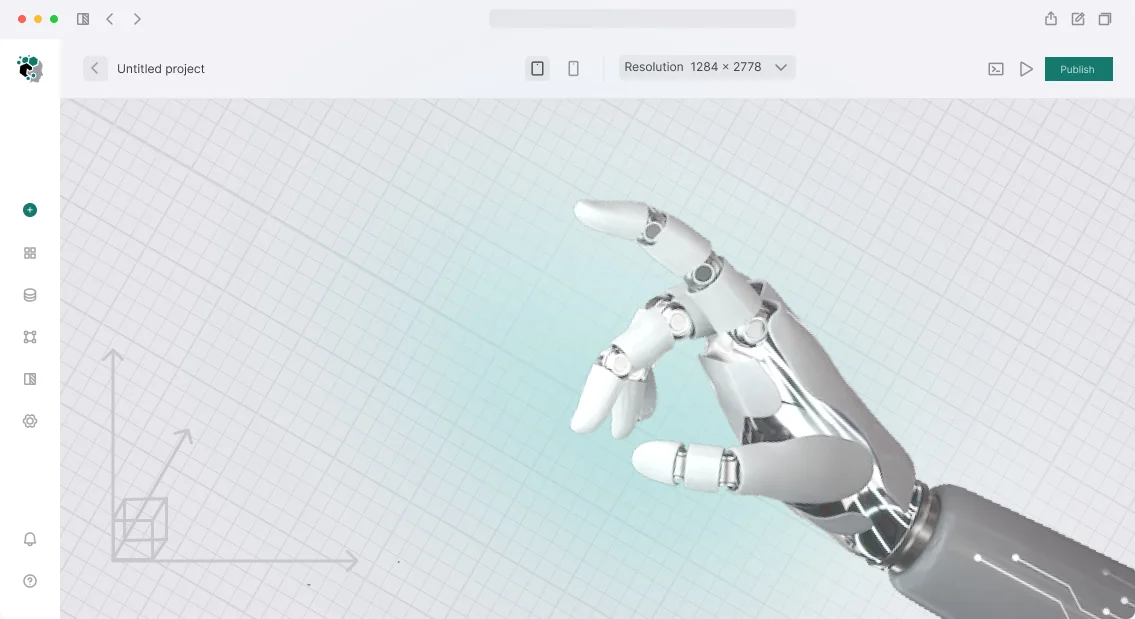






How much are you losing without a digital twin of your solar plant?
Without a digital twin, a solar plant remains a “black box”: you see only the final figures in a report, but you do not understand exactly where energy is lost or why generation is declining.
Every cloudy week, every dirty module, or a suboptimal tilt angle quietly eats into your profit, and the cause can only be discovered after an expensive inspection.
Losses without a digital twin consist of three main categories.
The first is lost generation due to inefficient equipment operation: without an accurate model, you do not know how the plant should perform under given conditions, you do not see deviations, and you do not react in time.
The second is the cost of maintaining the solar plant: scheduled and emergency work is carried out blindly, with a margin, and downtime on the sunniest day results in substantial lost-generation costs.
The third is design errors that surface after commissioning and require rework, instead of being corrected at the modeling stage.
A digital twin of a solar plant solves these problems. It collects data from sensors and inverters, creates a virtual copy of the equipment, and shows its condition in real time, forecasts generation based on weather, and warns about failure risks.
Instead of rough estimates, you get an accurate picture of what is happening in every section of the plant and can act ahead of time.
Maintenance also stops being “by schedule” — the twin tells you which element truly needs attention and which can continue operating. This reduces the cost of spare parts and crew labor, and most importantly eliminates losses from unplanned downtime. As a result, the plant generates more income with the same investment.
We develop digital twins for owners and operators of solar plants. Our engineers build a model of the “digital sun” and the entire infrastructure, teach the system to predict failures, and optimize operations. This covers your main risks and makes the plant manageable and transparent.
What you get: from visibility to savings
The main benefit of a digital twin of a solar power plant is visibility at every stage of the project lifecycle. You see the future facility as a whole before construction begins: panel layout, infrastructure, landscape.
This removes the risks of misunderstanding between the customer, investors, and contractors and speeds up decision approval.
When construction is underway, the digital twin becomes a control tool. By comparing actual work with the virtual model, you notice deviations at an early stage and prevent errors that would later be costly. Process transparency means confidence in deadlines and budget without visiting the site.
After the facility is commissioned, the benefits of 3D visualization show up in maintenance savings.
The twin accumulates data on equipment operation: you see which components wear out faster, where efficiency is lost, and you plan maintenance based on actual condition rather than the calendar. This reduces repair costs and increases the plant's output.
The overall effect is project manageability at all stages: from concept to daily operation. You get not just a model but a working tool for coordination, control, and cost optimization.
Implementing a digital twin pays off through reduced downtime, fewer errors, and a predictable result.
Digital twin formats: from diagrams to simulators
The same object can be shown in different ways — from a simple diagram to a full simulator. The question is not which format is “better,” but which one more accurately solves your task: attract an investor, train staff, or show the object to a client who cannot come to the site.
Below are typical digital twin formats for a solar station and their practical value.
| Format | For whom | What it gives the client |
|---|---|---|
| 2D animated diagram | Website, presentations, tender documentation | Simply and quickly explains how the station works even to a non-specialist, increases trust in the project |
| Interactive 3D model | Investors, partners, project teams | Shows the station structure in detail: you can “disassemble” the object, view key components and make sure of the solution’s reliability |
| Virtual tour of a solar station | Potential customers, guests, press | Immersion in the object without traveling to the site — saves time and creates the effect of personal presence |
| Training simulator | Operators, service engineers, new personnel | Practice actions without risk to equipment: employees master processes faster and make fewer mistakes in real work |
We select the format for the budget and audience: for some tasks, clear animation is enough; for others, a full-fledged training simulator. Tell us who will use the digital twin — we will propose the option that pays for itself fastest.
Project stages: from brief to commissioning
So that you understand what happens at each stage of development, we work according to a fixed procedure. We lock down tasks, deadlines, and acceptance criteria — this means fewer disputes and unnecessary rework.
- Visualization brief. We dive into the task: we study the station's schematics, interview operators, and identify which scenarios need to be covered. Based on the results, we send you a work plan and an estimate without hidden options.
- Concept and prototype. We create a draft 3D model of the key objects so that you can see the style and content before the main resources are invested.
- 3D model approval. We show the model from different angles and make revisions to the equipment composition, color schemes, and level of detail. Here you approve the "skeleton" of the future twin.
- Implementation and data population. We populate the model with the station's current parameters, create an animation of its operation, and configure the display of metrics. You receive a working version for testing.
- Digital twin deployment. We connect the model to your operational scenarios, test it under real conditions, and train employees to work with the object.
- Commissioning and support. We transfer the project for testing.
- Commissioning and support. We transfer the project to your facilities and hand over the source materials and instructions. After launch, we stay in touch: we update the model if the station's composition changes.
This order makes it possible to see progress at every stage and influence the result without missing deadlines. Ultimately, you get a digital twin that staff can understand and that immediately works toward the business's goals.
What is included in the delivery: project composition
The project composition includes not only a finished 3D model but also a complete delivery package — from source files to staff training. We form it so that you can use the twin immediately after launch, without additional requests to us.
- Visual 3D model of the station with equipment detailing and linked to the real site. It is used for employee training, protecting projects before investors, and visual monitoring of the condition of facilities.
- Source project files in editable formats. You are not dependent on us for updates: any team with the right tools can make changes and refine the model for new tasks.
- Interactive viewing environment: convenient navigation through objects, information layers, and a site walkthrough mode. This speeds up finding the required node and working with data many times over.
- Explanatory documentation and regulations for working with the model. They describe usage scenarios, the purpose of layers, and the data update procedure — useful for new employees and external contractors.
- Staff training: a practical session with your team where we cover how to open the project, work with filters, and export data for reports. We conduct it after launch and answer questions during the warranty period.
- Test scenarios and acceptance checks. Together with you, we go through key usage situations to make sure: the model solves the tasks of your business area, and doesn't just look pretty.
This package covers the main risk of digital twin projects — dependence on the contractor. You get both the tool itself and the knowledge of how to manage it. The model remains with you, and the source files protect the budget from repeated spending on similar refinements.
Case study: how our project paid back its investment in 6 months
Our client, an agro-industrial holding Yuzhnye Polya, owned a solar power plant that powered a pumping system and warehouse complexes. The main pain point was unplanned downtime due to inverter failures and unnoticed generation losses. Every hour of downtime cost a significant amount, and on-site diagnostics took up to two weeks.
We built a digital twin of the plant: an interactive 3D model that mirrors in real time the behavior of all key components—from irradiance levels to module temperature.
Instead of a pile of reports, the dispatcher received a clear visual schematic: the system itself highlighted risk and suggested which unit to check without waiting for a breakdown.
Results for the first year of operation: generation increased by 9%, maintenance costs decreased by an amount calculated after audit, and the average response time to a deviation fell from two weeks to two hours.
The development cost paid back in 6 months—after that, the model delivered net profit. The client's team stopped depending on emergency contractor visits: scheduled work is based on the model's forecast, not the calendar.
The payback of the visualization turned out to be so obvious that after the second season the holding ordered a similar twin for its second site.
We consider payback the main criterion of any digital project and set target metrics in the contract: reduced downtime, increased generation, savings on repairs. These are not promises but a return-on-investment plan.
How to choose the right visualization format?
Choosing a visualization format for a solar plant starts not with technology, but with the goal. One client needs to show an investor what the facility will look like before construction even begins. Another needs to train staff to service a plant that is already in operation.
A third needs to set up generation monitoring and quickly spot deviations. Which task is the main one determines what fits: a detailed 3D walkthrough, an animated 2D video, or an interactive digital twin.
When it comes to presenting a project to partners or local residents, the best choice is a realistic 3D visualization. It immediately shows the scale, the layout of panels and infrastructure, and lets you "walk" the site before installation starts.
For reporting and day-to-day management, an animated 2D diagram with energy flows and key metrics is more convenient: it reflects the state of the plant in a compact form, and the data is easy to update.
For training technical staff and everyday operation, you need a real-time digital twin. This is not just a pretty picture, but a working model of the plant that shows how every element performs.
An engineer understands faster where a failure may occur and acts more precisely during maintenance. This format pays for itself through reduced downtime and fewer errors.
Our team selects the visualization for a specific plant: we take into account capacity, area, climate specifics, and who will use the result — an investor, an operator, or a service department.
We do not push the most "spectacular" format, but offer the one that will solve your task. As a result, you get a tool, not just a video for the sake of checking a box.
If you are unsure where to start, start with the question "what should the visualization change: attract financing, speed up commissioning, or cut the time it takes to find faults?".
The answer will point to the format, and we will help you bring it to life on schedule and with a warranty.
Key client questions before project start
Before project start, clients most often ask about timelines, costs, and guarantees. These are the right questions — they help plan the budget and launch. Below we answer the main ones so you can make a decision without guessing.
How long will it take to create a digital twin of a solar power plant?
The timeline depends on model complexity and number of scenes. A typical project takes 2–4 weeks, but we give the exact date after the brief. We run the project in stages: you see intermediate versions and make edits, so the result doesn't become a surprise.
How much does such visualization cost? The cost is calculated for your task: number of objects, detail level, need for animation. Before the start, we fix the cost in the contract — it does not change during the process.
For most projects, the guideline is calculated after an audit; we provide the exact estimate after discussing the task.
What guarantees are there that the result will be suitable? We start with a brief and script, then you approve the key frames and style. Edits at each stage are included in the cost.
If something does not match the agreed technical specification, we revise it free of charge until full compliance.
What will I get in the end? A finished video or interactive twin in the formats you need, source files, and brief usage instructions. We also stay in touch after delivery — answer questions and help with launch.
Let's discuss your project? Get a cost estimate
Let's discuss the details of your project and prepare a transparent cost estimate — you will know the exact timeline and budget before work begins.
Submit a request, and our engineer will contact you within one business day, clarify the tasks and propose the optimal solution for your budget.
What you get after reaching out:
- Cost estimate for your task — we will lock in the scope of work and the final price, with no hidden extra charges as the project progresses.
- Selection of the 3D/2D animation format to match your goals: an investor presentation, staff training, equipment demonstration or a marketing video for your website.
- Examples of similar projects from our practice — we will show how we solved tasks for companies in the energy and industrial sectors.
- A clear work plan with stages and deadlines — you will understand what is happening at each step and when you will receive the finished result.
- Recommendations on using the digital twin: where to place it, how to apply it for sales, exhibitions, tenders or employee training.
- A technical specification and estimate in a convenient format — we document all agreements so you can approve the project without unnecessary back-and-forth.
Leave your contact details via the form on the page or message us in a messenger. We will respond within one business day, advise you on timelines and cost, and after the discussion we will prepare a proposal with exact figures for your project.