







3D Visualization of Scientific Research: How to Bring Data to Life
Results of a scientific study often look convincing only in a laboratory journal: tables, graphs, formulas. An external reader — an investor, grant provider, or company management — needs a clear picture.
Without it, even significant discoveries lose the battle for attention and funding. Until the data is "brought to life," the value of the work remains behind seven seals.
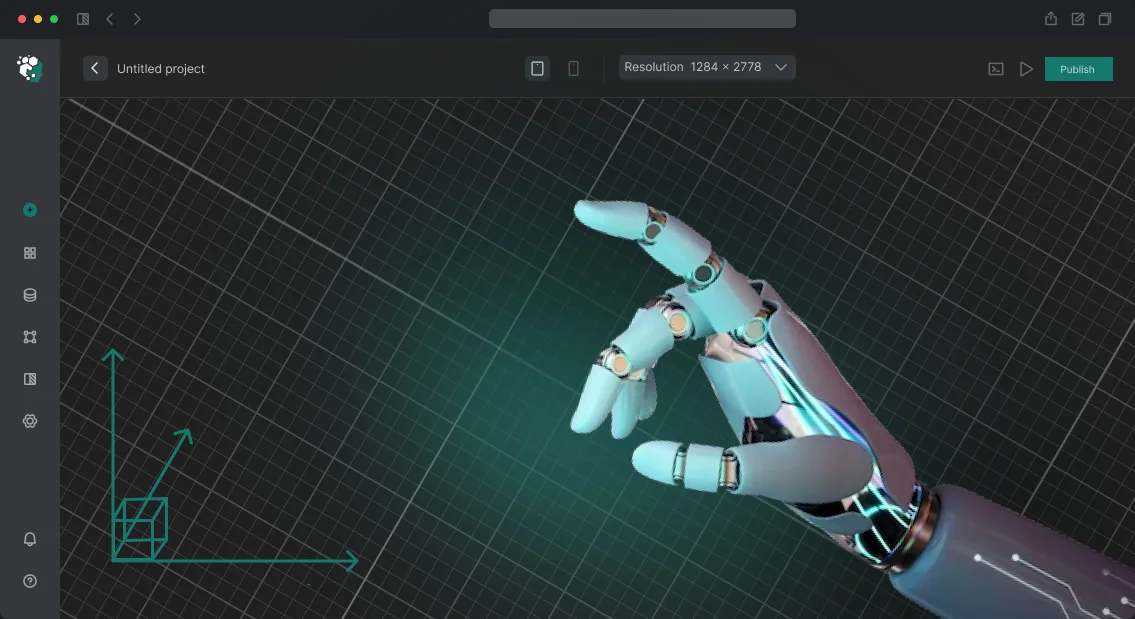
3D visualization of a scientific study translates complex results into an image that is understood at first glance. Processes, structures, and patterns turn into a visual narrative — you can show how a molecule binds, how load is distributed, how demand changes over time.
Data visualization helps shorten the distance between a discovery and its understanding, and clarity becomes the study's greatest ally.
In practice, this strengthens the research presentation at defenses, conferences, and negotiations. Instead of a dozen slides with charts — one memorable video that people discuss and share.
The chance of getting a grant or project approval increases, and a publication with visual materials attracts more attention from the scientific community and the press. The team gets not just a "picture" but a tool for growing funding and reputation.
We help teams bring data to life: we handle 3D modeling, animation, and editing. We align the content with your materials, achieving scientific accuracy and visual appeal.
As a result, your research looks modern, and most importantly — its value is noticed by those who make decisions.
The Results of Your Work Will Become Clear and Convincing
Clear Explanation of Complex Results
Experts and ordinary people perceive images faster than text and tables. Three-dimensional visualization turns abstract data into images that don't need deciphering.
When your research — for example, Mechanisms of Cellular Regeneration — is shown in 3D, the audience sees processes, not just numbers. This removes the barrier between your work and its understanding, even for those far from the topic.
More Citations and Dissemination
Visual materials are readily shared by colleagues and the media. The easier a result is to grasp, the more often it is talked about, and the more references to your publication appear in other works.
Every such piece works toward your scientific reputation. Clear visualization is a way to turn your article from "just another publication" into work that is cited and remembered.
Success in Grant Applications
Experts who decide the fate of an application see dozens of similar texts. Your advantage is a visual result that already inspires trust. A 3D model or animated video shows that you understand your own research and know how to present it.
Clear visualization reduces risks for the grant provider: it is easier to invest in a project that looks well-developed and complete.
Trust of Colleagues and Investors
Professional presentation speaks to the seriousness of the team and the level of work. When you arrive with a finished visualization, it strengthens your position in discussions, at conferences, and in negotiations with partners.
Investors and management make decisions faster when they see the end result rather than raw data. It looks like a completed product — which means it inspires trust and a willingness to collaborate.
Presentation Formats: Video, Interactive Model, Complex Graphics
Scientific data is hard to explain in words: text and graphs take time to read, while audience attention is limited.
Therefore, the presentation format determines whether the result will reach the reader of an article, the client of a project, or the visitor of an exhibition — and whether it convinces them.
We select a format for the task: from a short video for a website and social media to an interactive 3D model that can be rotated and examined in detail. Below are typical scenarios that clients come to us with.
| Format | For whom | What it gives the client |
|---|---|---|
| Scientific video (2–5 minutes) | For websites, investor presentations, public lectures | Explains a complex idea in 3 minutes instead of 30 pages of text; holds the viewer's attention and is memorable |
| Image-building video with 3D graphics | For the marketing department, press service, social media | Increases brand recognition and makes the research visual for a wide audience |
| Interactive 3D model | For web pages, museum exhibitions, educational portals | The visitor explores the model themselves — this increases time on site by 3–5 times and engages more deeply than passive viewing |
| Complex graphics for publications | For scientific articles, reports, and dissertations | Reviewers and colleagues understand the methodology faster; the article looks more convincing and is cited more often |
Whichever format you choose, we provide source files and versions adapted for different platforms. This means the result can be used in a print article, on a screen, or in an interactive catalog — without extra charges for revisions.
You don't need to choose a format yourself: at a briefing, we'll show examples and help determine what will work for your task.
Client Workflow Stages: From Briefing to the Finished Result
We've structured the work so that you always understand what stage the project is at and what you'll get in the end. No "black boxes" — you participate at key points, control quality, and see the result before the final render.
- Briefing and immersion in the task. You tell us about the purpose of the visualization, the audience, and expectations. We clarify details, propose a format, and set realistic project timelines.
- Analysis of source data. We study scientific materials and research data. We determine what to show visually and what to simplify so the viewer grasps the essence even without deep knowledge.
- Script and style. We create a storyboard: what appears after what, which accents matter. You see the logic of the video before production and can adjust it.
- Layout approval. We show a draft with key frames. You make edits — this is faster and cheaper than redoing finished animation.
- Render and production. We create the final 3D graphics, animation, and color correction. You receive intermediate versions for quality control.
- Edits and project handover. We make final adjustments and deliver the source files and ready-to-use files for the website, presentations, social media, or TV screens. The project is closed — you get material that works for your goal.
Delivery Package: Materials for Publication and Presentation
Receiving the finished 3D visualization is only half the result. Without a properly assembled package, you'll spend days on modifications: either the journal needs a different format, or the files won't open in the presentation.
We take care of the technical side and hand over a package that can be used immediately in publications, defenses, and new applications.
- Video for journals and publications — videos in different formats: for the website, presentations, and article appendices.
- Interactive 3D model — opens on a computer and in the browser: the viewer rotates the model and examines details themselves.
- Series of static images — ready-made frames for articles, posters, and social media.
- Project source files — 3D files and working materials so your team can make edits.
- Working instructions — a quick reference: which files to use for which tasks and how to show the model to colleagues.
- Methodology description — explanations of assumptions and simplifications for reviewers and colleagues.
All materials are structured and labeled so that any project participant can quickly find what they need. If the target journal or conference has special file requirements — we study them in advance and adapt the package without extra work on your part.
Case Study: How We Helped a Research Center Present Its Results
For research centers and laboratories, the main problem is not science itself, but the ability to show its value to those who allocate funding. An expert committee sees complex tables and graphs, but makes a decision in a few minutes.
At that moment, what matters is not the volume of data, but how clearly and convincingly the idea is presented.
This was exactly the request we received from the Institute of Applied Research. Scientists had developed a new water purification method, but at a grant defense they couldn't explain its advantages without complex terminology.
We created a short 3D video that showed the process at the particle level: how contaminants are trapped while useful elements pass through. The visualization lasted a minute and a half, but in that time the committee saw the main thing — the technology works.
What the Client Received
The institute's application received a two-year grant. Committee members later noted that it was the visual material that helped them make a quick decision — without lengthy clarifications and additional questions.
The video itself became part of the application and was later used at conferences and in reports to partners.
This case shows: quality visualization pays off not as an expense for a picture, but as a tool that brings in funding.
How to Choose the Right Format for Your Work?
Choosing a format is the answer to the question of where and how your work will be seen. A scientific article lives in text, a conference lives in a live presentation, a website lives in free exploration, a grant application lives in the strict evaluation of experts.
Therefore, the same material needs to be shown differently, and we help determine which option will work for your goal.
For an article, detailed 3D illustrations are best: they can be examined calmly, compared with the text, and saved for citation. Such images should be self-sufficient — without a presentation, the reader should understand the key idea.
We create visualizations that withstand close scrutiny and still look appropriate in a scientific publication.
For a conference, on the contrary, dynamics are needed. A short animation video of 30–60 seconds holds attention and allows you to show a complex process or research stages sequentially.
While you speak, the audience follows the motion — this way information is absorbed faster and stays in memory. This is especially valuable when you're given only 10–15 minutes for a presentation.
If the work is intended for a website or grant application, it's worth considering a comprehensive format. On a website, this could be an interactive 3D model that the visitor rotates and examines themselves, or a unifying video.
For an application, experts value a clear visual of the outlook: animation showing how the research will develop often becomes the decisive argument.
We recommend a format for your task, taking into account where the material will be seen and what it should "achieve." Article, conference, website, or grant — there is an optimal solution for each case, and we help you choose it without unnecessary expenses.
Addressing Clients' Concerns Before the Project Starts
Any project begins with doubts: accuracy, timelines, budget. According to our analysis of client inquiries, these are the main fears before starting. We answer common questions about guarantees, revisions, timelines, and the cost of visualization.
How do you guarantee the accuracy of visualization?
We work strictly from your source data: publications, datasets, methodologies. We show each stage in intermediate versions — you see how numbers become an image. Key parameters are recorded in the brief.
Can the cost of visualization change during the process?
No. After the brief, we fix the cost in an estimate and do not change it. The estimate includes the concept, modeling, render, and two iterations of revisions. For scientific tasks, one iteration is often enough — budget savings.
How long does a project take?
Usually two to four weeks for a finished video. The exact timeline depends on the volume of data and approvals. The deadline is fixed in the contract and respected — there are control points along the way.
Can I make revisions after the finished version?
Yes. Two iterations of revisions are already included: we change accents, colors, labels, and angles. If you need more — we'll calculate the cost separately. We accept edits as a list of notes or comments on individual frames.
How do you ensure the security of source data?
We transfer all materials under a confidentiality agreement and store them on secure servers. Access is limited to the project team. After completion, we return the source files and delete copies.
Start Preparing Your Presentation Materials Today
Preparing presentation materials is often put off due to a busy schedule. But right now the data is fresh and the research hasn't yet been presented to a wide audience. Start today to gain an advantage in your project defense or publication.
You don't need to understand the intricacies of 3D graphics. Our engineers and artists will propose a solution that conveys the essence of the research and strengthens its perception — by a jury, investors, or the scientific community. We work remotely and are ready to fit into your schedule.
Ordering visualization from us means getting:
- preliminary consultation and cost calculation without hidden fees;
- agreed timelines with the right to control at each stage;
- a choice of style — from rigorous scientific graphics to image-building video;
- several iterations of revisions so the result matches your vision;
- source files and adapted versions for presentations, videos, and interactive displays.
Getting in touch is simple: leave a request on the website — we'll contact you within one business day, clarify the details of your research, and offer visualization options to fit your budget. This way you can calculate the cost of your specific project and make an informed decision.
Don't put off presenting your research — every week of delay postpones recognition of your work. Write to us now, and together we'll turn complex data into a clear and convincing result.